School-system reports of state-source gifted education revenue, aggregated by state · FY2014–2024 · U.S. Census Bureau Annual Survey of School System Finances
$1.62B
Reported in FY2024 — a ten-year high
The sum of separately identified state gifted aid grew 59% in nominal terms from $1.02B in FY2014, reaching its highest point in FY2024. After a brief dip during the pandemic years (2021–2022), funding has rebounded sharply.
18 / 51
States with any positive reported aid in FY2024
Only 18 of 51 jurisdictions separately report any gifted-specific state revenue. 21 report zero, and 12 have no usable data at all. The number has been remarkably stable — between 16 and 19 — across the entire decade.
87%
Held by just two states: Georgia and Florida
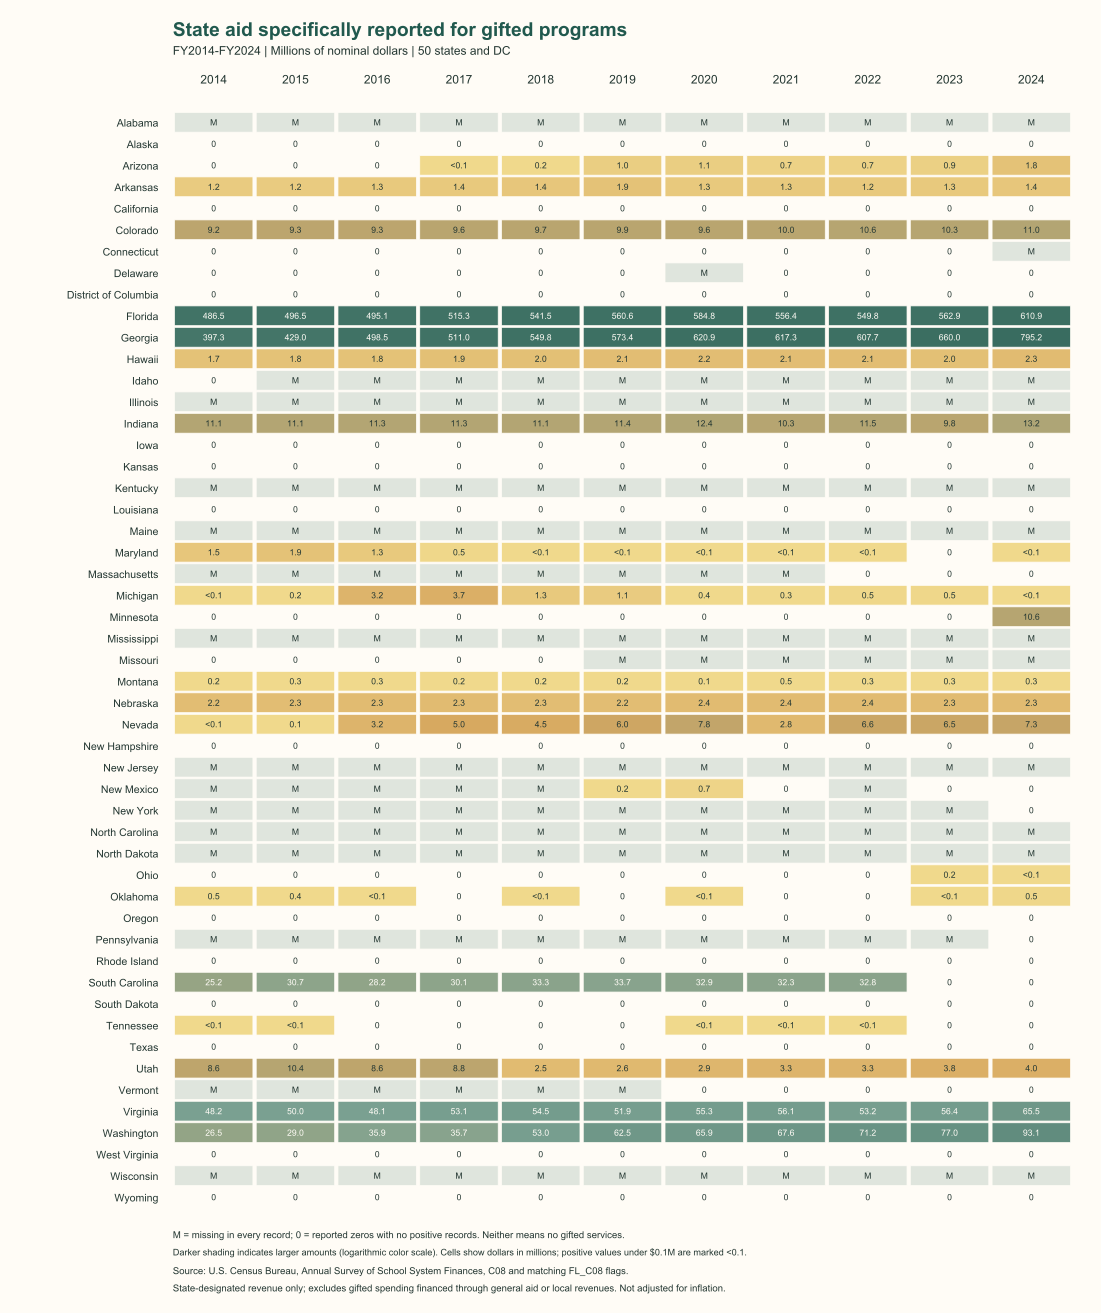
Georgia ($795M) and Florida ($611M) together account for 87% of all reported gifted aid nationally. The remaining 16 positive states share just $214M — meaning the "national" picture is really two outliers and a long tail.
⚠
These figures are a floor, not a ceiling
This measure aggregates school-system survey records for state-source dollars separately identified as gifted funding. It is not a direct census of state agency spending: funding routed through general aid, local levies, or federal grants may not appear here. Zero and missing do not establish that services are absent, and missing records can coexist with substantial funding reported through other channels.
Source: U.S. Census Bureau, Annual Survey of School System Finances (F-33). Item C08, defined in the Census documentation as state revenue for "Gifted and talented programs." FY2014–FY2024, nominal dollars, not inflation-adjusted.
Amounts come from each year's individual-unit data file; reporting status comes from the matching flag file (FL_C08: R = reported, M = missing), joined on STATE, PID6, and UNIT_TYPE. Raw zeros in M-flagged cells are treated as missing, not as zero funding. FY2023 and FY2024 verified directly against the official flag files elsec23f and elsec24f: 14,088 and 14,077 school-system records respectively, with 9,169 and 10,262 reported.
$1.62B
Total separately reported state gifted aid, FY2024
Up 59% nominally from $1.02B in FY2014
18
States with any positive separately reported gifted aid in FY2024
12 states missing all records · 21 reporting zero
87%
Share of FY2024 total held by Georgia & Florida alone
GA $795M · FL $611M · all others $214M combined
What you're looking at:
These figures aggregate school-system records from the U.S. Census Bureau's annual finance survey. They capture state-source revenue that school systems separately report for gifted and talented programs; they are not state agency reports or a complete census of state spending.
They don't include general aid that flows to gifted services, or local funding.
A state showing zero or no data doesn't necessarily mean it provides nothing — it may fund gifted education through its general formula instead.
Dollar amounts are nominal (not adjusted for inflation). Year-to-year changes can reflect policy, reporting practices, or how a state classifies its spending.
State-by-year reports · nominal millions. Yellow shows lower positive amounts; green shows higher amounts. M indicates a missing report; zero and missing are distinct. Open the figure full size.
Reported aid, FY2014–2024
Sum of separately reported state gifted aid · millions of dollars (nominal) · states with ≥ 1 positive year
FY2024 · All states
State aid by year
2024← drag to change year
Positive aid: lower → higher
Reported zero
Missing (no data)
Color intensity scales logarithmically within the positive tier. Both "zero" and "missing" mean the state reported no positive gifted aid amount —
but missing means all records lacked a valid flag, while zero means records were present with no positive value.
Neither establishes the absence of gifted funding.
Within-state trends · FY2014–2024
Only states with at least one year of positive separately reported gifted aid are shown. Each panel uses its own vertical scale to reveal within-state change.
Missing years are shown as gaps. South Carolina dropped from ~$33M to zero after FY2022 — likely a classification shift.
Minnesota appeared for the first time in FY2024 with $10.6M.
Reporting coverage · FY2014–2024
Wisconsin · Reporting coverage
Wisconsin has no separately reported gifted aid in any year from 2014 to 2024.
All Wisconsin school system records in the Census survey are flagged as missing for state-source gifted revenue every year in this dataset. That doesn't mean Wisconsin provides no gifted services — but it does mean the state has not separately identified gifted funding in a way that appears in this federal finance survey. Wisconsin is one of 12 jurisdictions in this situation in FY2024.
A consistent subset of states report positive gifted aid; a larger group consistently reports zero or is missing.
The missing category has gradually declined (14 in 2014 → 12 in 2024), suggesting marginally improving coverage over the decade.
Because the reporting set isn't fixed, year-to-year changes in the national total partly reflect who reports, not just how much they spend.
How "missing" is determined: the Census publishes a flag for every school system and every finance item. For gifted aid the flag is either R (the state reported a figure) or M (no figure was reported). A missing cell contains a raw zero in the data file, which is why it must be read alongside the flag rather than taken at face value — otherwise every non-reporting state would look like a state spending nothing.
States per category · each year
PositiveZeroMissing
Always-missing states (FY2024)
States reporting $0 (FY2024)
Your state
Type a state name to see its full 11-year record of separately reported gifted aid.